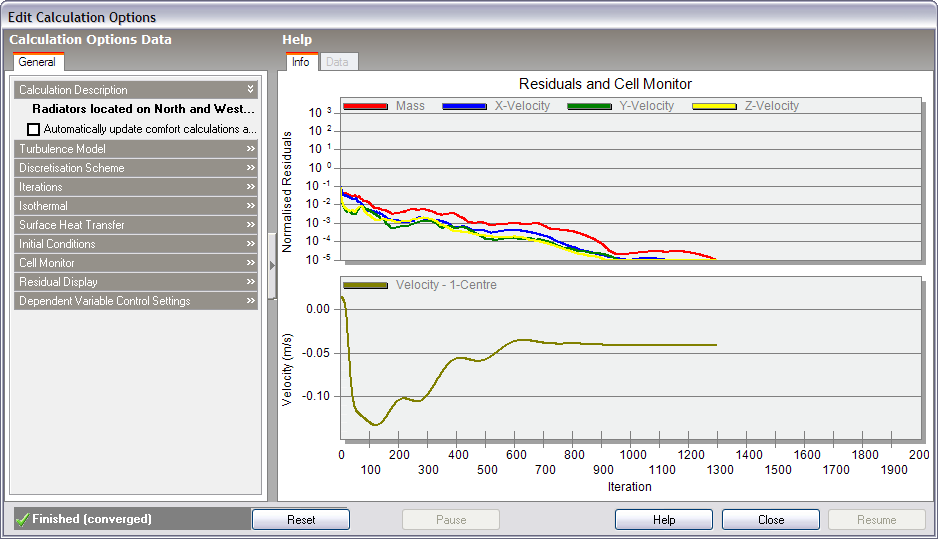
During the CFD simulation, you can monitor the progress of calculations by keeping an eye on residual and cell monitor graphs. The value of each selected dependent variable residual together with the mass residual is plotted on the residuals graph, at the end of each outer iteration of the calculation. You can use the residuals plot to monitor the overall convergence of the solution and to determine whether or not any remedial action is required.
When considering the residual plots, you should bear in mind that the residuals can fluctuate quite markedly throughout the period of the calculations and in some cases rise appreciably before falling and so you need to get an idea of the overall trend after several hundred iterations. The following screenshot shows a plot of residuals and a default centrally located monitor cell plot for the internal analysis illustrated in the Displaying Results section. Notice that the monitored velocity has reached a steady final value.
If you notice that the residuals are fluctuating wildly or steadily increasing over several hundred iterations, you should pause the calculations and take remedial action (see Convergence Difficulties and Troubleshooting section).
The cell monitor graph displays the variation in the selected dependent variable for the currently selected monitor cell (see Setting Up CFD Cell Monitor Points section and Cell Monitor setting in the CFD Calculation Options section). The variation of monitored cell point variables provides a good indication of solution convergence, i.e. when the variation of the variable stabilises.